Product
Taurus Technical Test
From CSV files to a metrics API and an interactive dashboard
A data technical test I took from raw CSV files to a metrics API and an interactive dashboard.
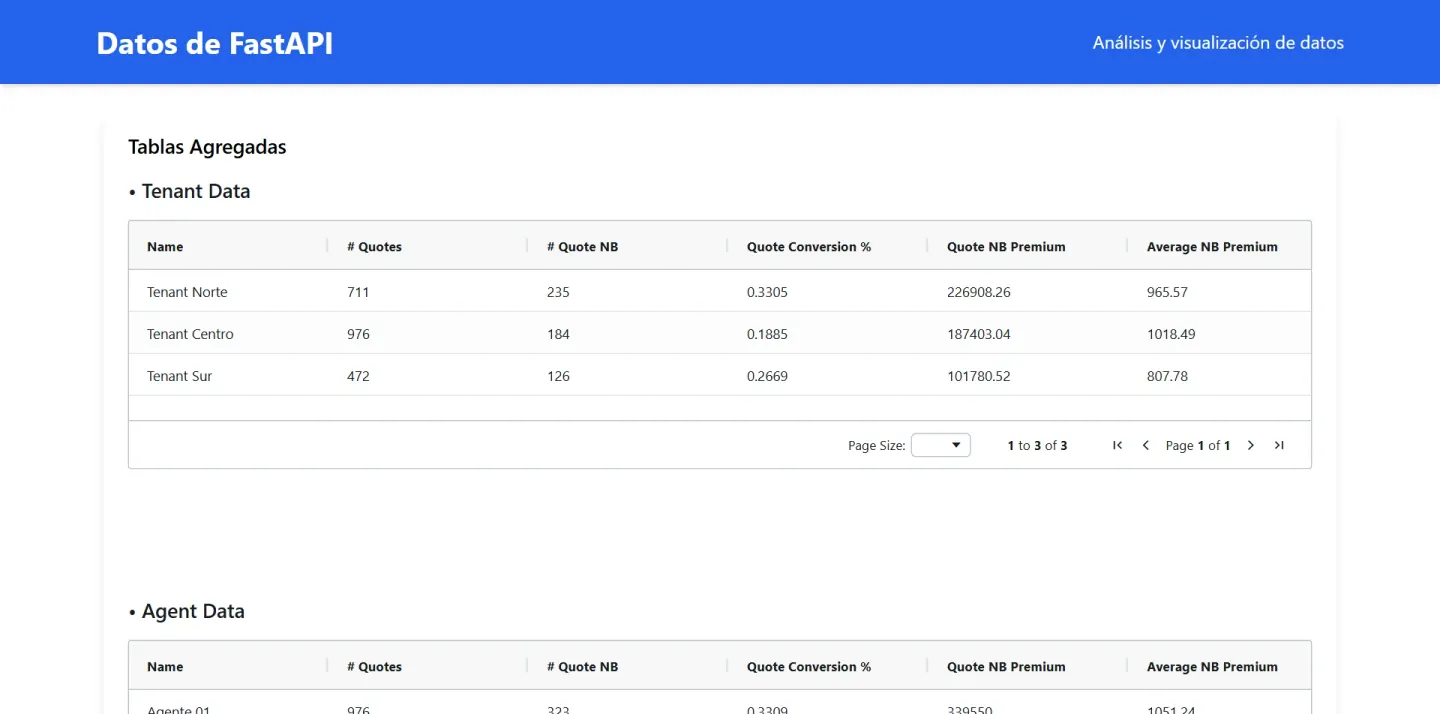
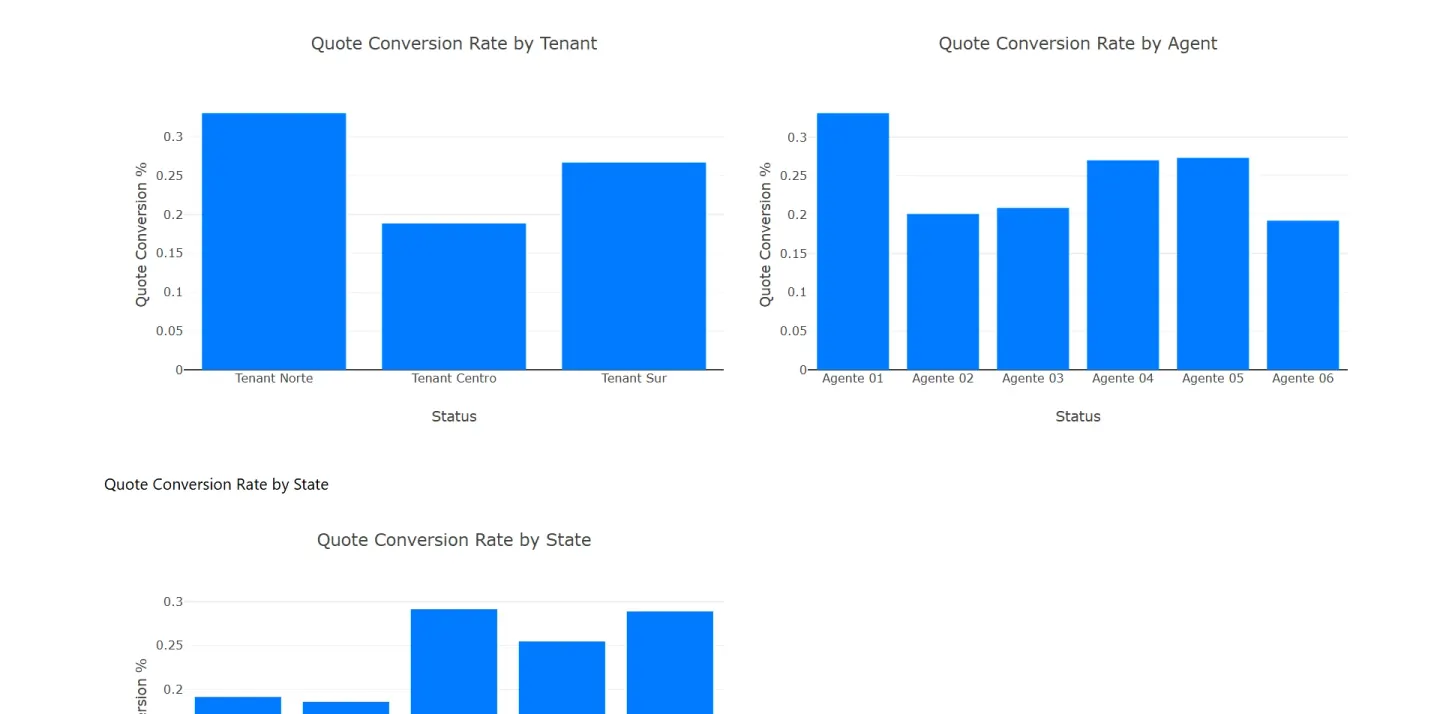
What it is about
A data technical test I solved in three repositories, one per layer, for loading and analyzing the CSV files, a metrics API and a dashboard to explore the metrics.
What it does
- Loading the CSV files into MySQL and MariaDB, with exploratory analysis in Pandas inside a notebook.
- FastAPI metrics API with async SQLAlchemy that groups the data by tenant, agent and state.
- React and TypeScript dashboard with an AG Grid table to explore the records.
- Plotly.js charts to compare the metrics of each group.
How it works
From files to dashboard
Data flows left to right, from CSV to the database, from the database to the API and from the API to the dashboard.
Data
- The test's CSV files
- MySQL and MariaDB
- Exploratory analysis in Pandas
API
- FastAPI with async SQLAlchemy
- Queries by tenant, agent and state
Dashboard
- React and TypeScript
- AG Grid table
- Plotly.js charts
Decisions and their costs
One layer per repository
The technical test had three parts, loading and analyzing the CSV files, a metrics API and a dashboard.
Repositories
Every public repository of the project, with what it holds.
- 2024Python, FastAPI, SQLAlchemy
Taurus-FastAPITaurusSebastian-s
The technical test's metrics API, grouped by tenant, agent and state.
- 2024React, TypeScript, AG Grid, Plotly.js
Taurus-FrontendTaurusSebastian-s
A React dashboard with an AG Grid table and Plotly charts.
- 2024Python, Pandas, MySQL
Taurus-DataAnalysisTaurusSebastian-s
Loading the CSV files into MySQL and exploratory analysis in a notebook.
Stack
Pick a technology to see the projects that use it.