Work project
Observability Platform
Metrics, logs, traces, probes and alerts for 20+ services
The stack that watches the integration services and the servers they run on, with metrics, logs, traces, probes and alerts in one place.
What it is about
With 20+ integration services in production, I needed to know when one failed without waiting for a team to report it. This repository holds everything for that, from what is measured and where it is stored to how it is seen and who gets told.
I built it in June 2026 and it runs next to the services it watches.
What it does
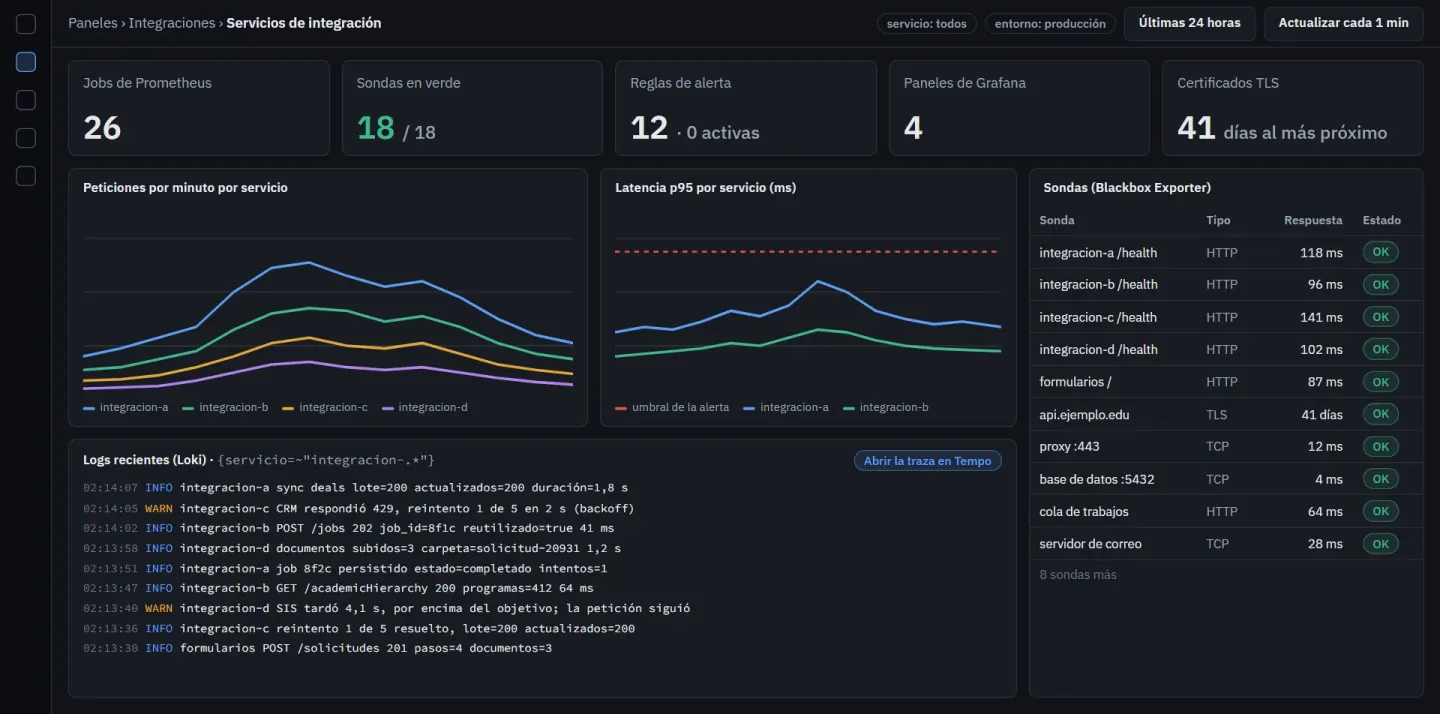
- Prometheus scrapes 26 jobs across the instrumented FastAPI services, the containers through cAdvisor, the machines through Node Exporter and Nginx through its exporter.
- 18 Blackbox Exporter probes check from outside that every service and every domain answers, and that their TLS certificates are not about to expire.
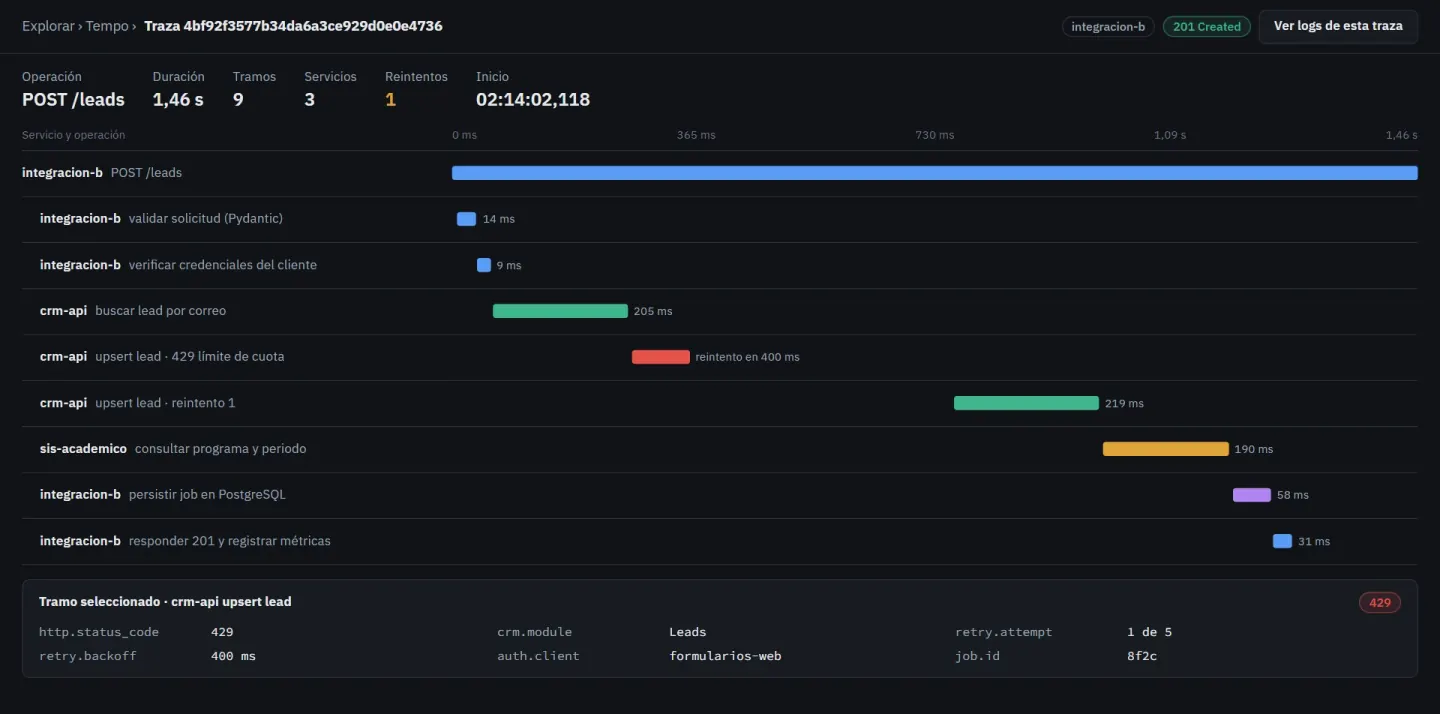
- Promtail ships the container logs to Loki through a read-only proxy of the Docker socket, and Tempo receives the services' OpenTelemetry traces.
- Grafana holds 4 dashboards (Docker, FastAPI, machine and Nginx) and 12 alert rules, among them 500 errors in the integrations, containers restarting in a loop, disk and CPU, which reach Telegram.
- Everything runs in Docker Compose next to the services, with 15 days of retention in Prometheus.
How it works
From signal to alert
Signals flow left to right; the bottom row is how the stack runs.
What is watched
- Instrumented FastAPI services
- Blackbox Exporter probes
- Containers, machines and Nginx
Collection
- Prometheus with 26 jobs
- Loki with Promtail
- Tempo with OpenTelemetry
Who finds out
- 4 Grafana dashboards
- 12 alert rules
- Alerts on Telegram
Operation
- Docker Compose next to the services
- Read-only proxy of the Docker socket
- 15 days of retention
Decisions and their costs
Probes from outside on top of metrics from inside
A service's metrics say nothing when the service is down or its domain does not answer.
The Docker socket behind a proxy
Promtail needs to discover the containers, but the full Docker socket would give it control over the server.
Alerts to Telegram
Alerts had to reach the phone without paying for an on-call service.
Stack
Pick a technology to see the projects that use it.


